vSAN Monitor

If this dashboard looks familiar this is because it is heavily inspired from vSAN Observer:
But unlike vSAN Observer, PoliGraf makes vSAN Monitor persistent because when you need it you most likely want to know what just happened. Since you have to launch vSAN Observer and wait few minutes, that particular moment is gone. vSAN Monitor let you explore 6 months from now so you can relax.
Nevertheless, vSAN Monitor is NOT a replacement for vSAN Observer since it only offers the primary “tabs” where you’ll be able to check the global activity of your vSAN cluster per nodes. When you need to deep dive, you’ll still need vSAN Observer. Badly.
Since some brillant guys at VMware already explain how to read vSAN metrics, you’ll need to check those papers if you not already did : Monitoring VMware Virtual SAN with Virtual SAN Observer & VMware Virtual SAN Diagnostics and Troubleshooting Reference Manual.
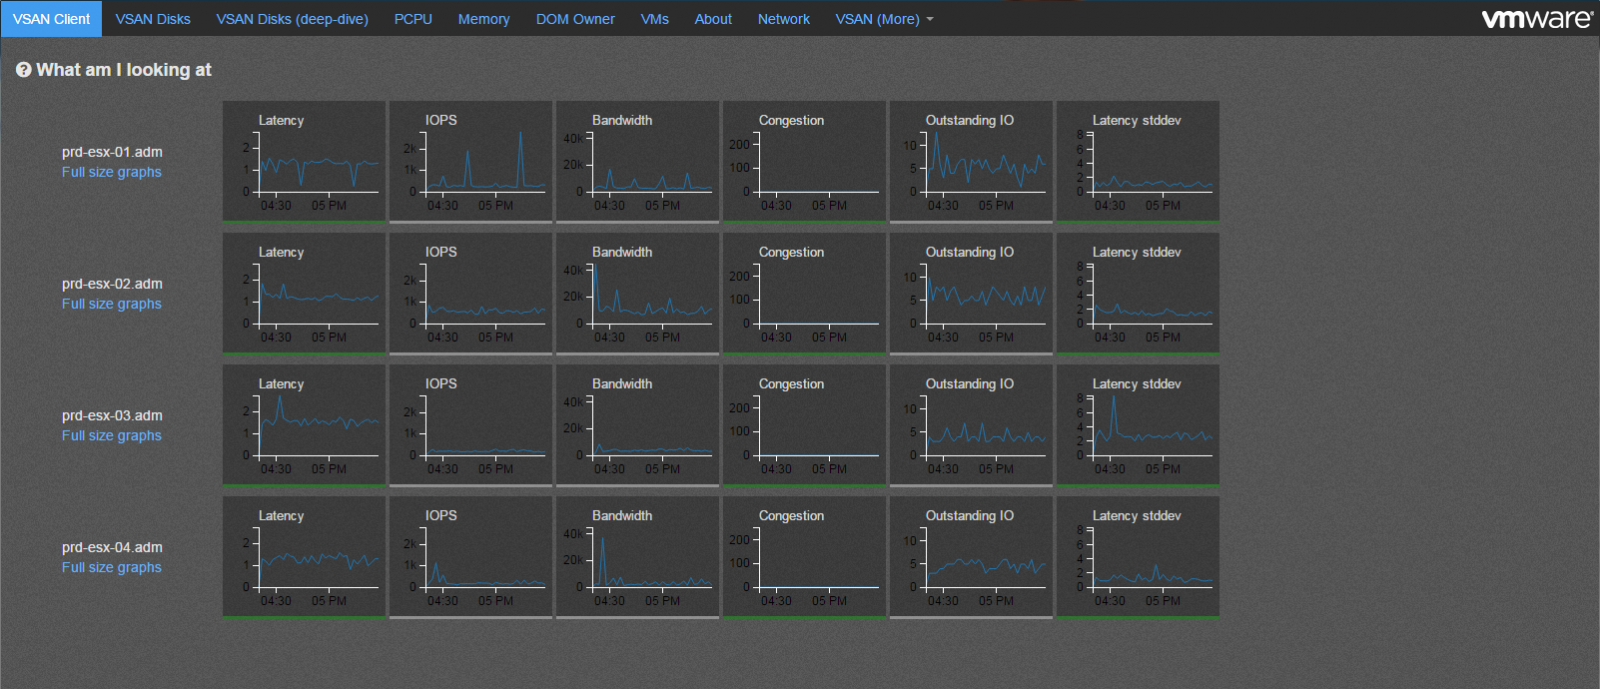
The layer label let you switch beetween vSAN layers described in the vSAN Observer help section:
Client: This view shows vSAN statistics from the view point of the vSAN client running on each host. In other words, this view represents the vSAN performance as seen by VMs running on the hosts for which statistics are shown.
If this view shows any unexpected performance, one needs to drill down further to understand where performance issues may be coming from. It is important to understand that due to the distributed nature of vSAN each host accesses data from all hosts, so any performance issue seen on this view may be caused by any host in the vSAN cluster.
Disks: This view shows vSAN statistics of the physical disk layer of each host. In other words, this view allows to determine if there is any contention on any of the disk groups that make up the overall vSAN cluster. Note that the statistics shown are purely the physical disk layer and do not include any other vSAN overhead (e.g. networking or vSAN RAID). Also remember that due to the distributed nature of vSAN the physical disks of one host are accessed by VMs on all hosts in the vSAN cluster.
If this view shows physical disk contention across a majority of hosts then this likely indicates that the workload run by VMs is collectively higher than the vSAN cluster can handle. In that case, either reduce the storage workload, or check the detailed physical device view to determine if you need more HDDs or SSDs.If however only a single host’s physical disks are contended, while other hosts are operating fine, then you may have an imbalance, e.g. caused by particularly noisy VMs.
Owner: The DOM owner is a vSAN internal layer. For every vSAN object vSAN elects one host to be the ‘owner’. The owner performance all RAID functionality and ensures correctness, even under concurrent access by multiple clients. All IO flows from the vSAN client to the owner and then to the disk layer. vSAN tries to co-locate the owner and the client to not incur an additional network hop. However, the user can’t influence where the owner for a given object is located, so reading the below graphs and correlating them with the client and disks graphs can be very difficult.
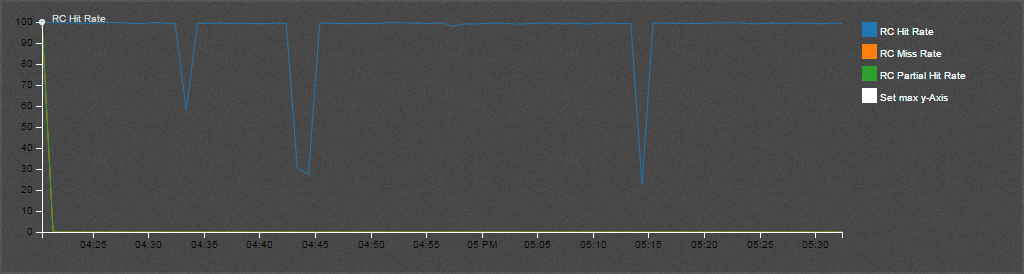
You may have noticed the last column is not Latency stddev but Read Cache Hit Rate since we believe it offers a more syntetic view. We also got thresholds like vSAN Observer but Grafana’s are areas so you know exaclty when the metric hits the roof and for how long. As per vSAN Observer settings, the threshold for latency is 30ms, 20 for congestion and 30 for latency SD.
We also added colors 😉
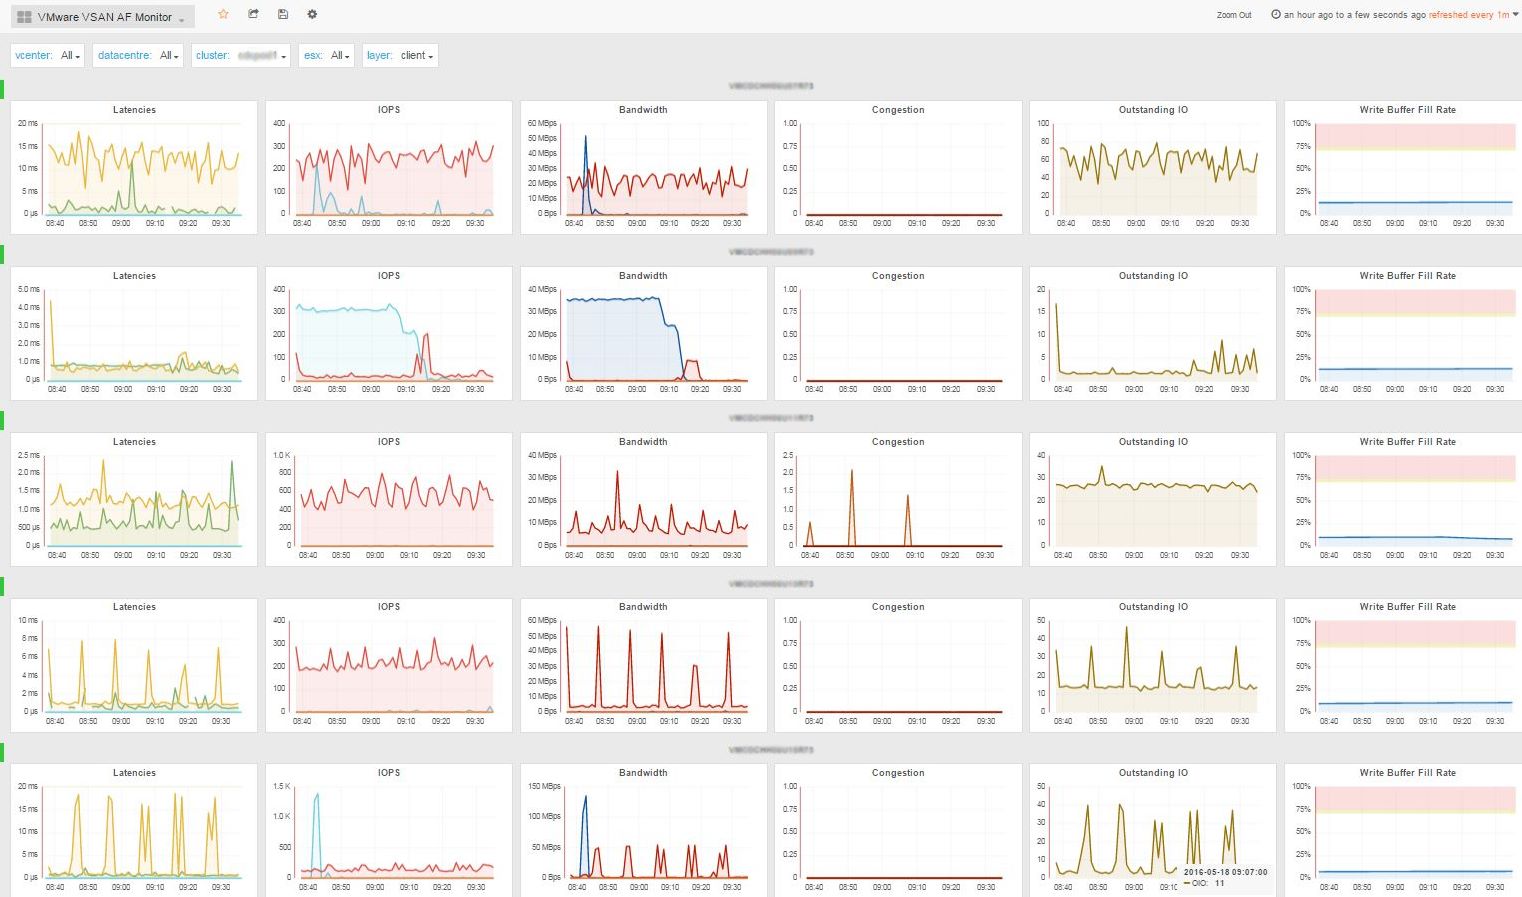
Since All Flash cluster has no SSD read cache, we added a dedicated AF version of the vSAN monitor dashboard in v0.99c
All-flash clusters have two types of flash: very fast and durable write cache, and more capacious and cost-effective capacity flash. Here cache is 100% allocated for writes, as read performance from capacity flash is more than sufficient.
Some of you also asked us a dashboard to let them monitor multiple vSAN clusters at once. Enjoy the new VMware Multi vSAN Monitor dashboard (from v0.99c):
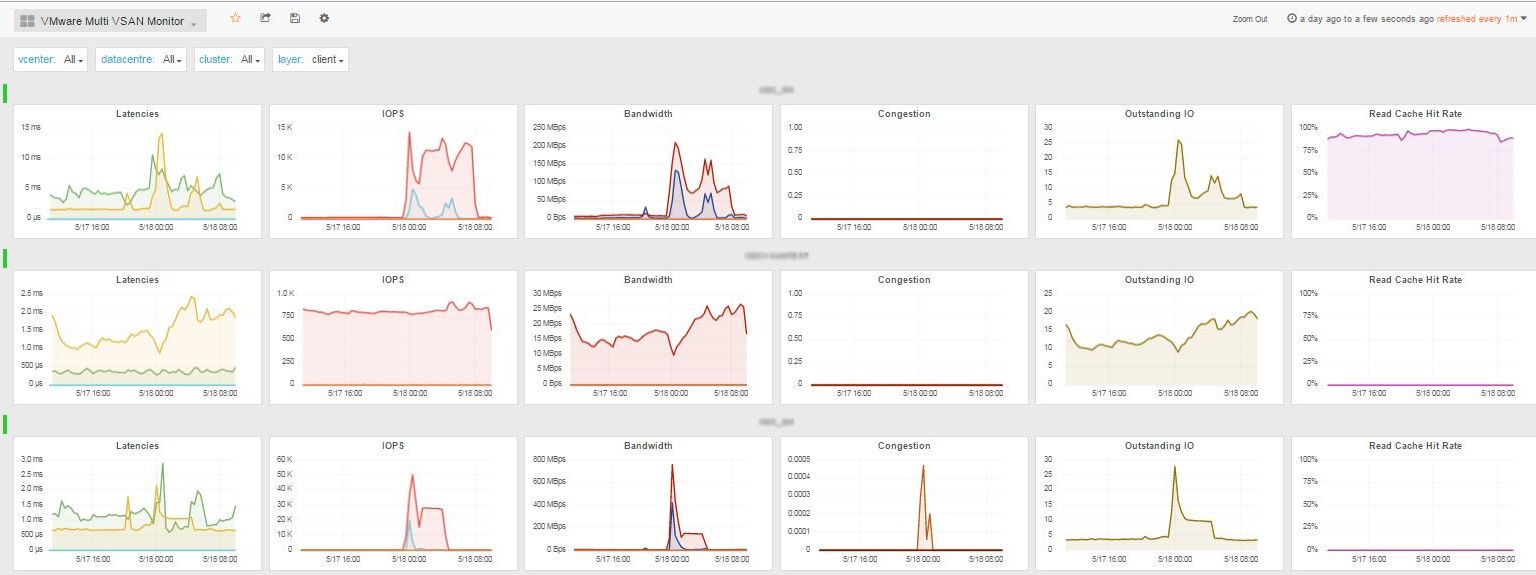
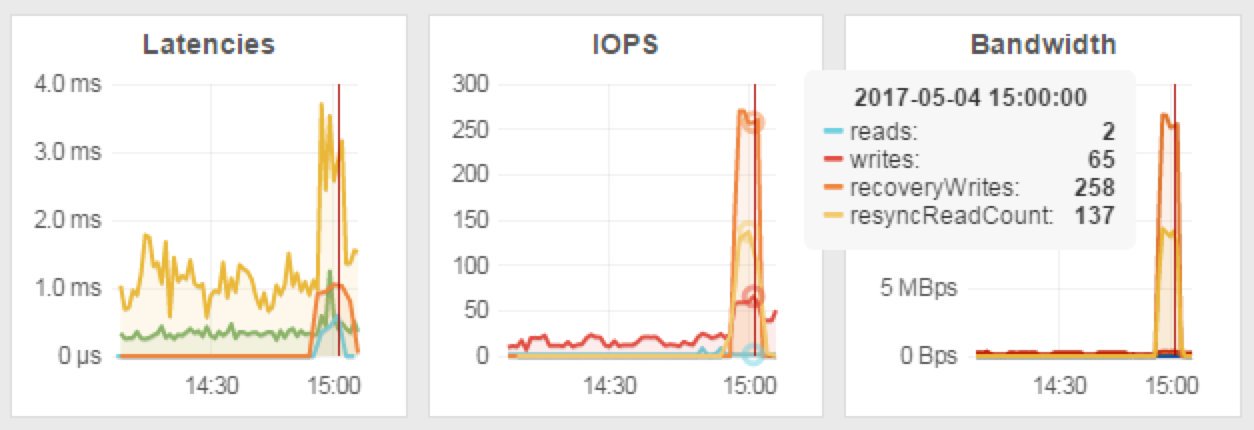
Support for vSAN 6.6 APIs has been added to PoliGraf 0.99d so for those having ESXi 6.5.0d+ vSAN cluster with v5 on-disk format, we’ve created an enhanced vSAN Monitor 66 dashboard with the new resyncRead and client.cachestats metrics.
The new client cache was introduced in vSAN 6.2 but not exposed in the public APIs until vSAN 6.6 release.
As of 6.2 vSAN also has a small in-memory read cache. Small in this case means 0.4% of a host’s memory capacity up to a max of 1GB. Note that this in-memory cache is a client side cache, meaning that the blocks of a VM are cached on the host where the VM is located.
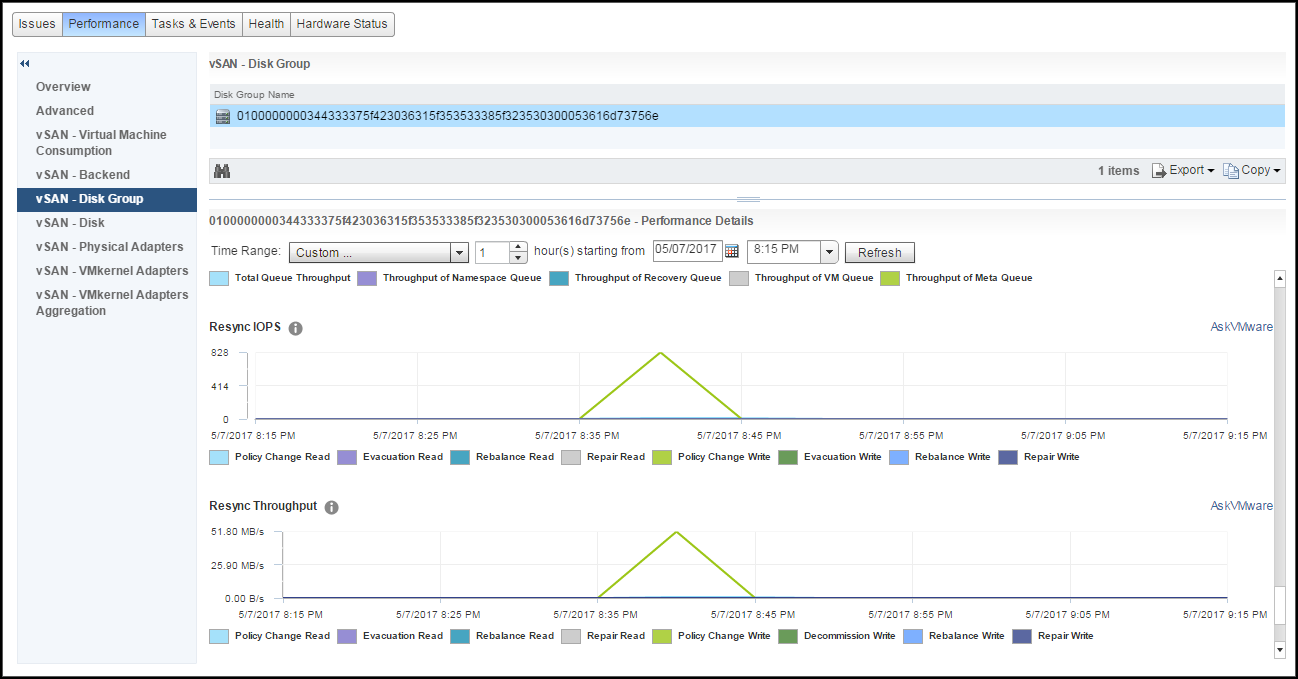
Since vSAN 6.6, you can also monitor the resync traffic per diskgroup from within the vCenter UI!! \o/