Multi Cluster Top N VM Latency
Storage latency is certainly one of the most critical metric to monitor because of its very unique effect on user perception. See how we could be amazed by NVMe devices for instance (if you don’t know what I’m talking about, stop everything and try one now). The 20 year old post from Stuart Cheshire is still very accurate, It’s the Latency, Stupid!
The very first version of PoliGraf came out with latency metrics of course but at the datastore level. During some troubleshooting involving storage latency, we noticed that sometimes the VM latency was way higher than the datastore latency where the VM was sitting. So in the 0.99d release, we decided to add the famous maxTotalLatency:
Highest latency value across all disks used by the host. Latency measures the time taken to process a SCSI command issued by the guest OS to the virtual machine. The kernel latency is the time VMkernel takes to process an IO request. The device latency is the time it takes the hardware to handle the request.
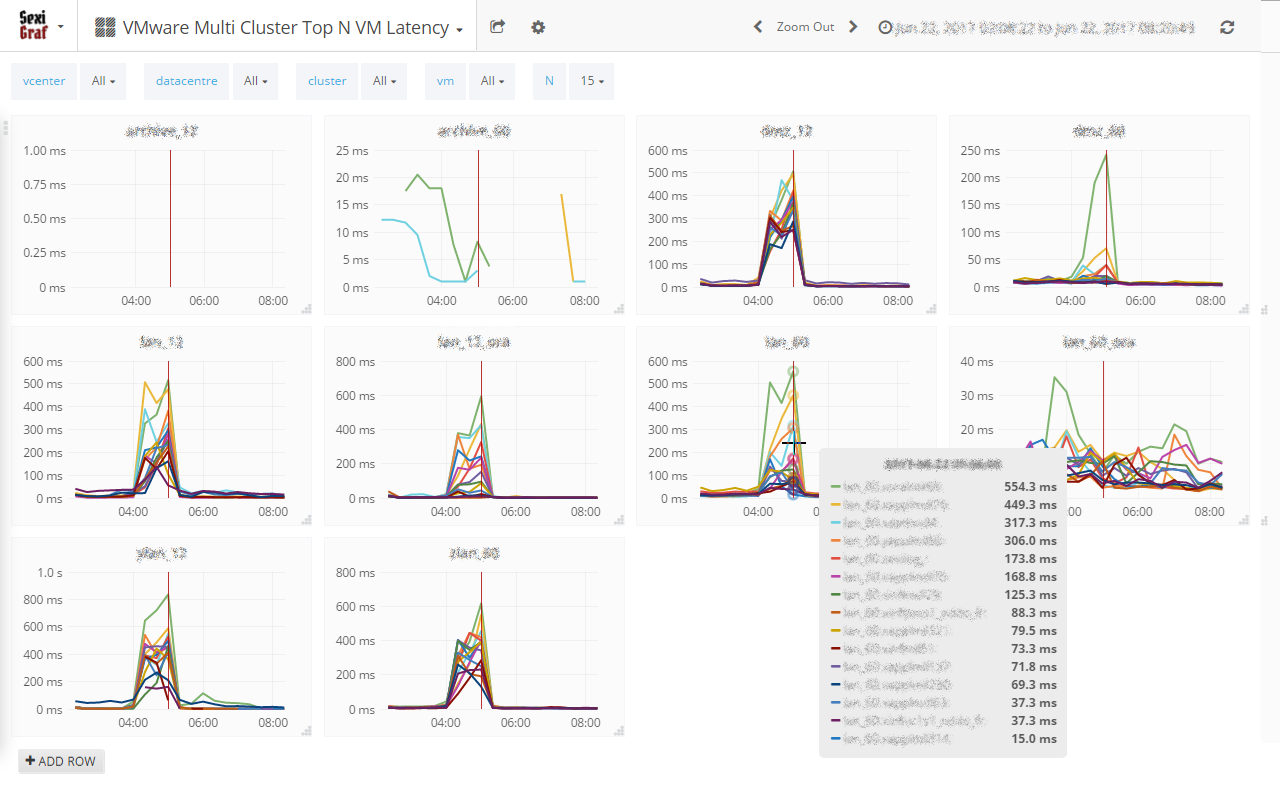
Meet the Multi Cluster Top N VM Latency where you can compare, per cluster, the top N maxTotalLatency metric of your VMs: