ESX FullStats
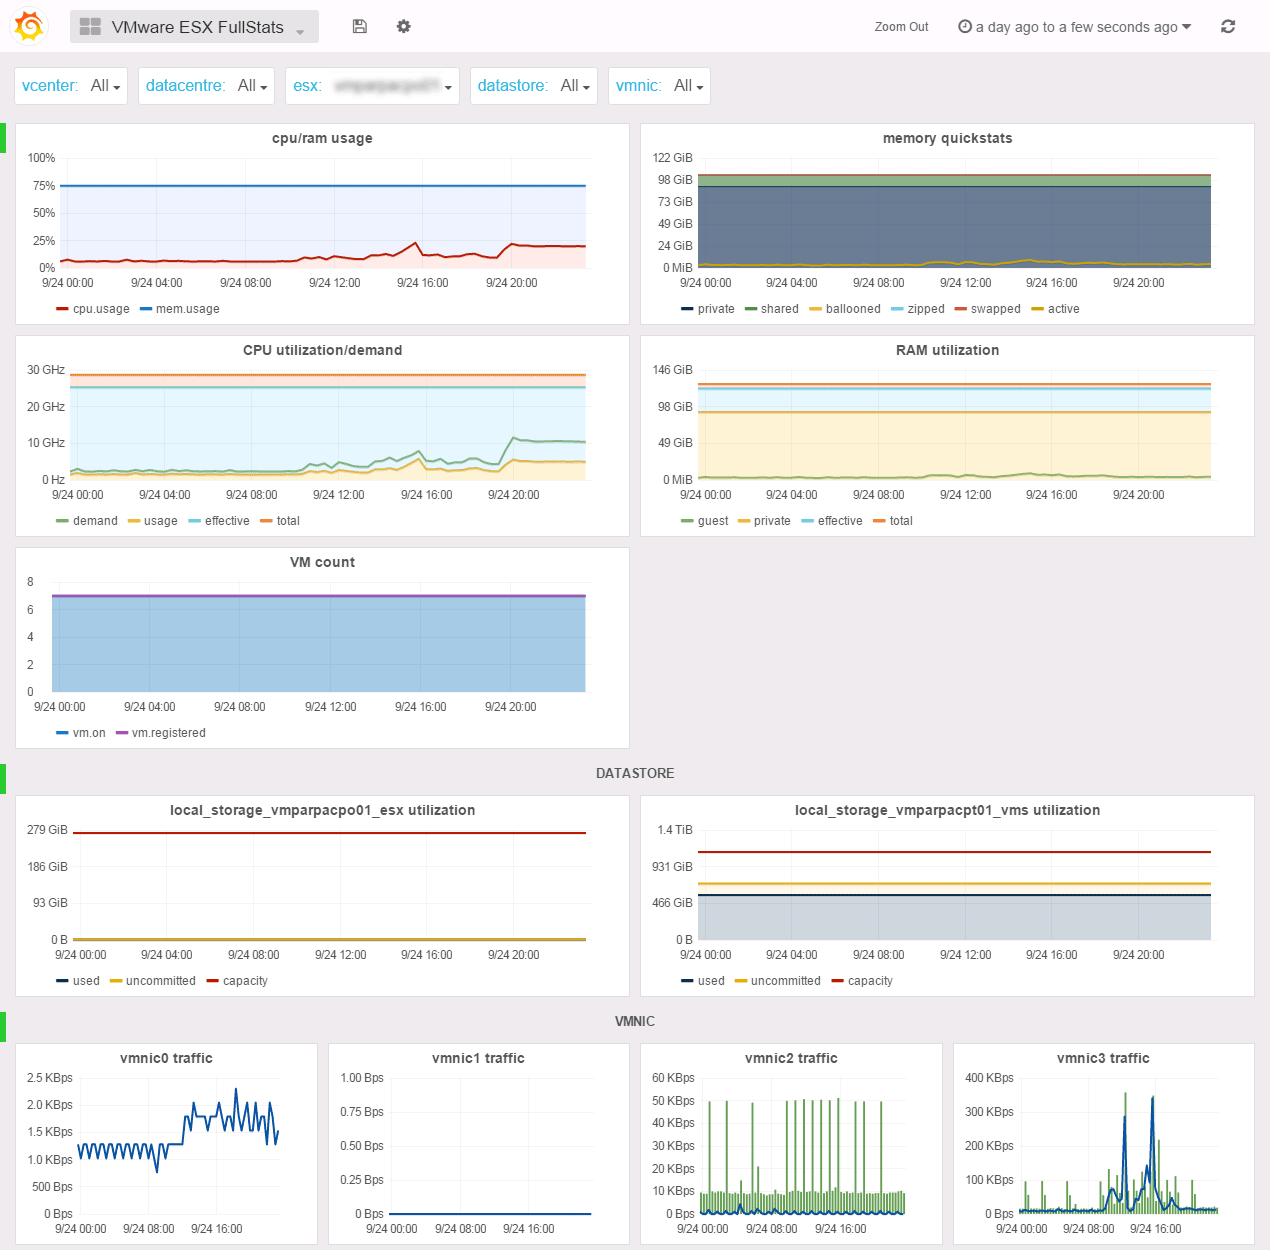
The ESX FullStats dashboard is similar to the Cluster FullStats but for standalone and unmanaged ESX servers. Because we focus on ESX resources here, we did not aggregated the datastore and vmnic metrics. You’ll find a graph for every single one of them but you can select which one will be displayed if not all.
Like in Cluster Fullstats, you’ll be able to track memory overcommit (i.e. TPS) in the memory quickstats graph but also CPU power management impact in the CPU utilization/demand graph if demand>usage.