SSD Stats
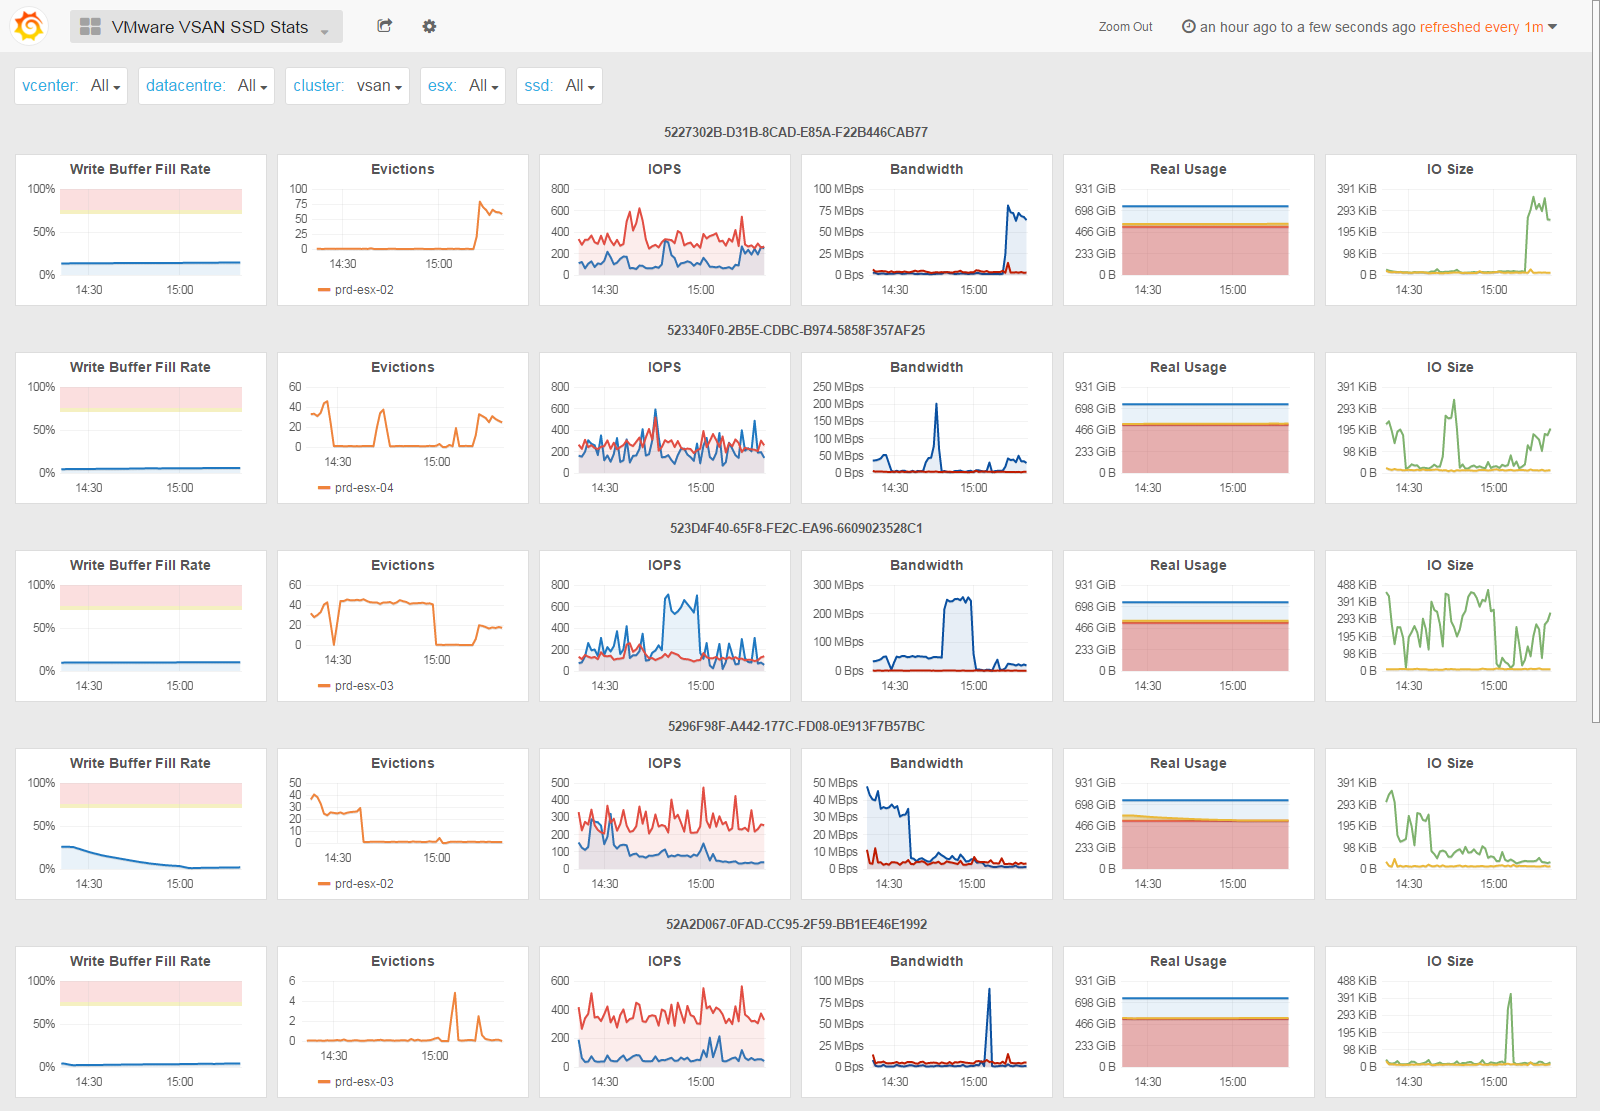
The vSAN SSD Stats dashboard shows various statistics from the caching devices of the vSAN diskgroups.
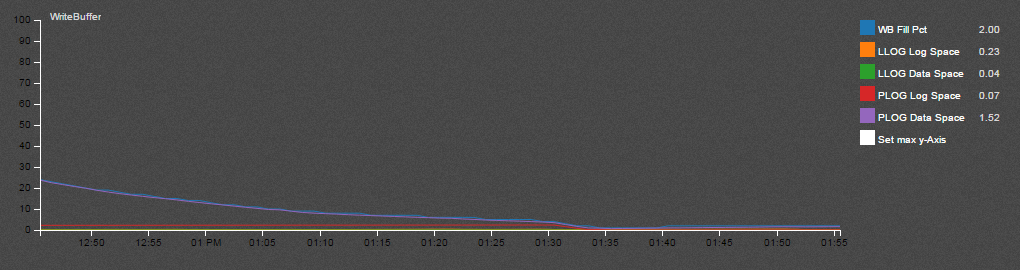
The Write Buffer Fill Rate graph is probably the most important as it helps to understand how fast the write buffer fills up and how fast the data are flushed on disk (or flash capacity). As per vSAN Observer settings, the threshold of this metric is 75%.
According to VMware Virtual SAN Diagnostics and Troubleshooting Reference Manual “One would expect that on a reasonably balanced system that a significant amount of write buffer is consumed. This is a good metric to check if you are planning to place more workloads on Virtual SAN. It can tell you whether you have enough flash capacity to cater for the additional workloads.”
The Evictions graph is described in VMware Virtual SAN Diagnostics and Troubleshooting Reference Manual as “how often Virtual SAN has to evict data blocks from the write buffer to make room for new data blocks. […] Excessive evictions could mean that there are workloads running that are not suitable for a caching storage system like Virtual SAN (sustained sequential write operations), or that the flash cache has been undersized for the workload requirements.”
The IOPS and Bandwidth graph are obviously speaking for themselves.
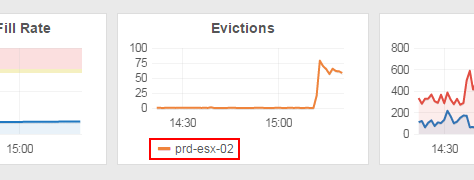
If you need to know where is the SSD your’re looking at, check the Evictions graph legend:
Starting from PoliGraf 0.99b we’ve added 2 new rows: Real Usage that let you monitor the vSAN flash tier filling up and IO Size that speaks for itself.
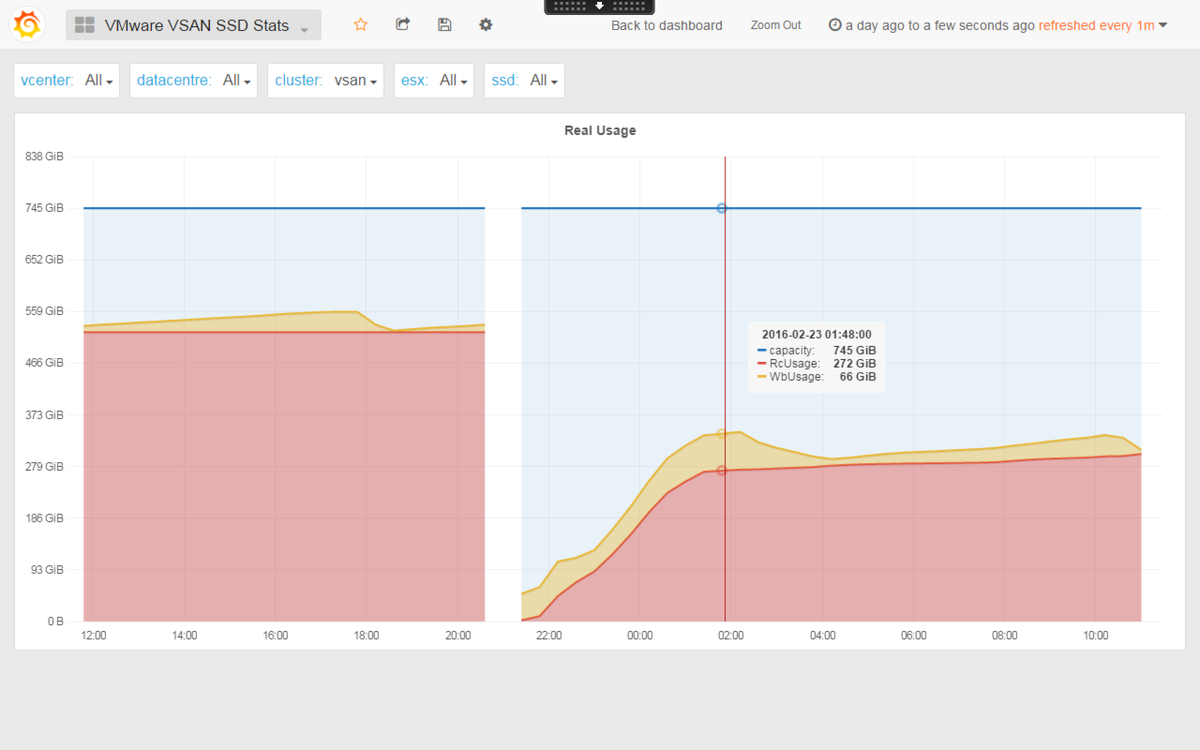
The Real Usage row may be very usefull to measure read cache warm up duration.