Cluster Network Usage
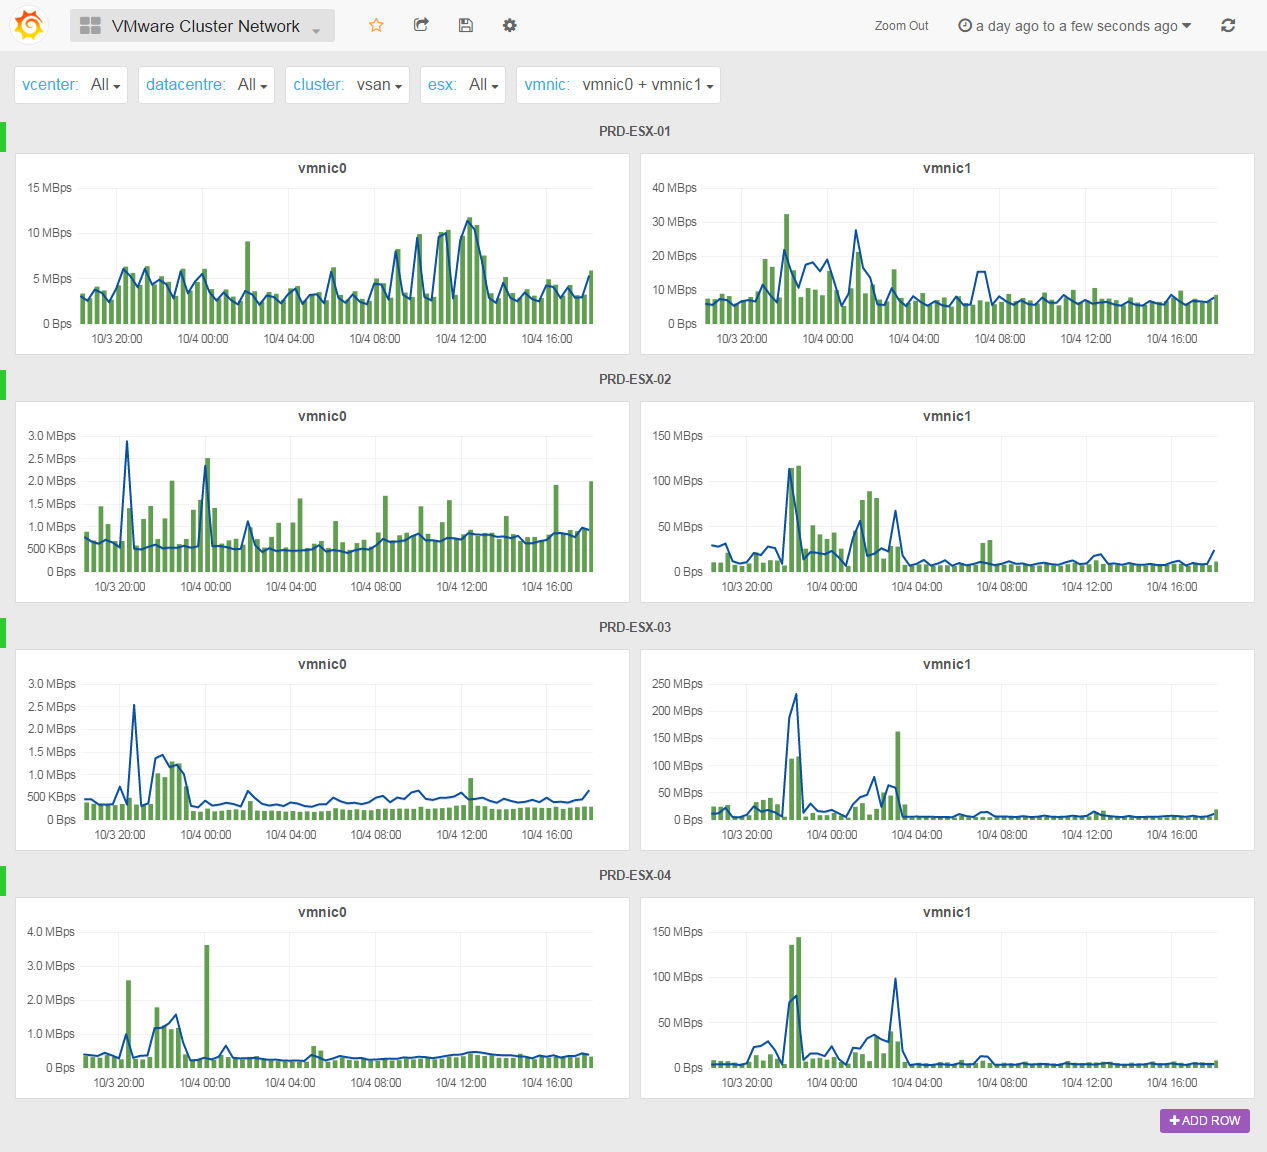
This dashboard allows you to compare the selected vmnic of the selected ESX in your favorite cluster. If this cluster is contained in a blade enclosure, you’re now able to check what is going in and out from your chassis. Noticed the cacti style of the graphs?
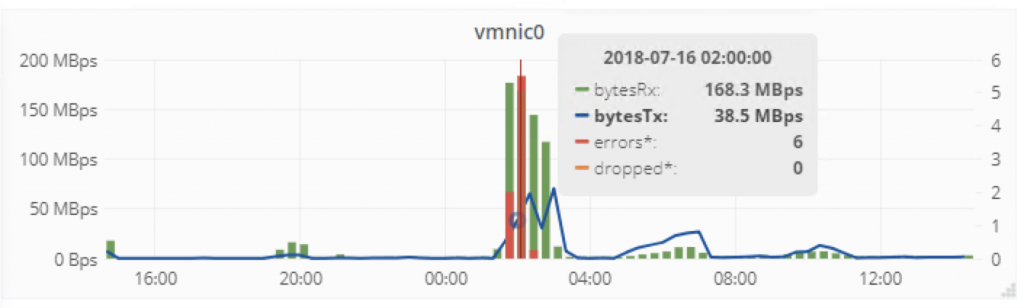
In version 0.99e, we’ve added the droppedTX, droppedRX, errorsTX and errorsRX counters (on the right Y axis) so can have a bit of history for those metrics in your favourite tool: