All Cluster Top N VM Stats
Starting from PoliGraf 0.99b you can monitor the top N VM quickstats***** (1 to 20 VM per graph). Now you can find the bad *sses of your datacenters!
Of course you can also search and pick some VM of your choice to compare their stats. The legend is formated as such to help you locate any tango: clustername.vmname

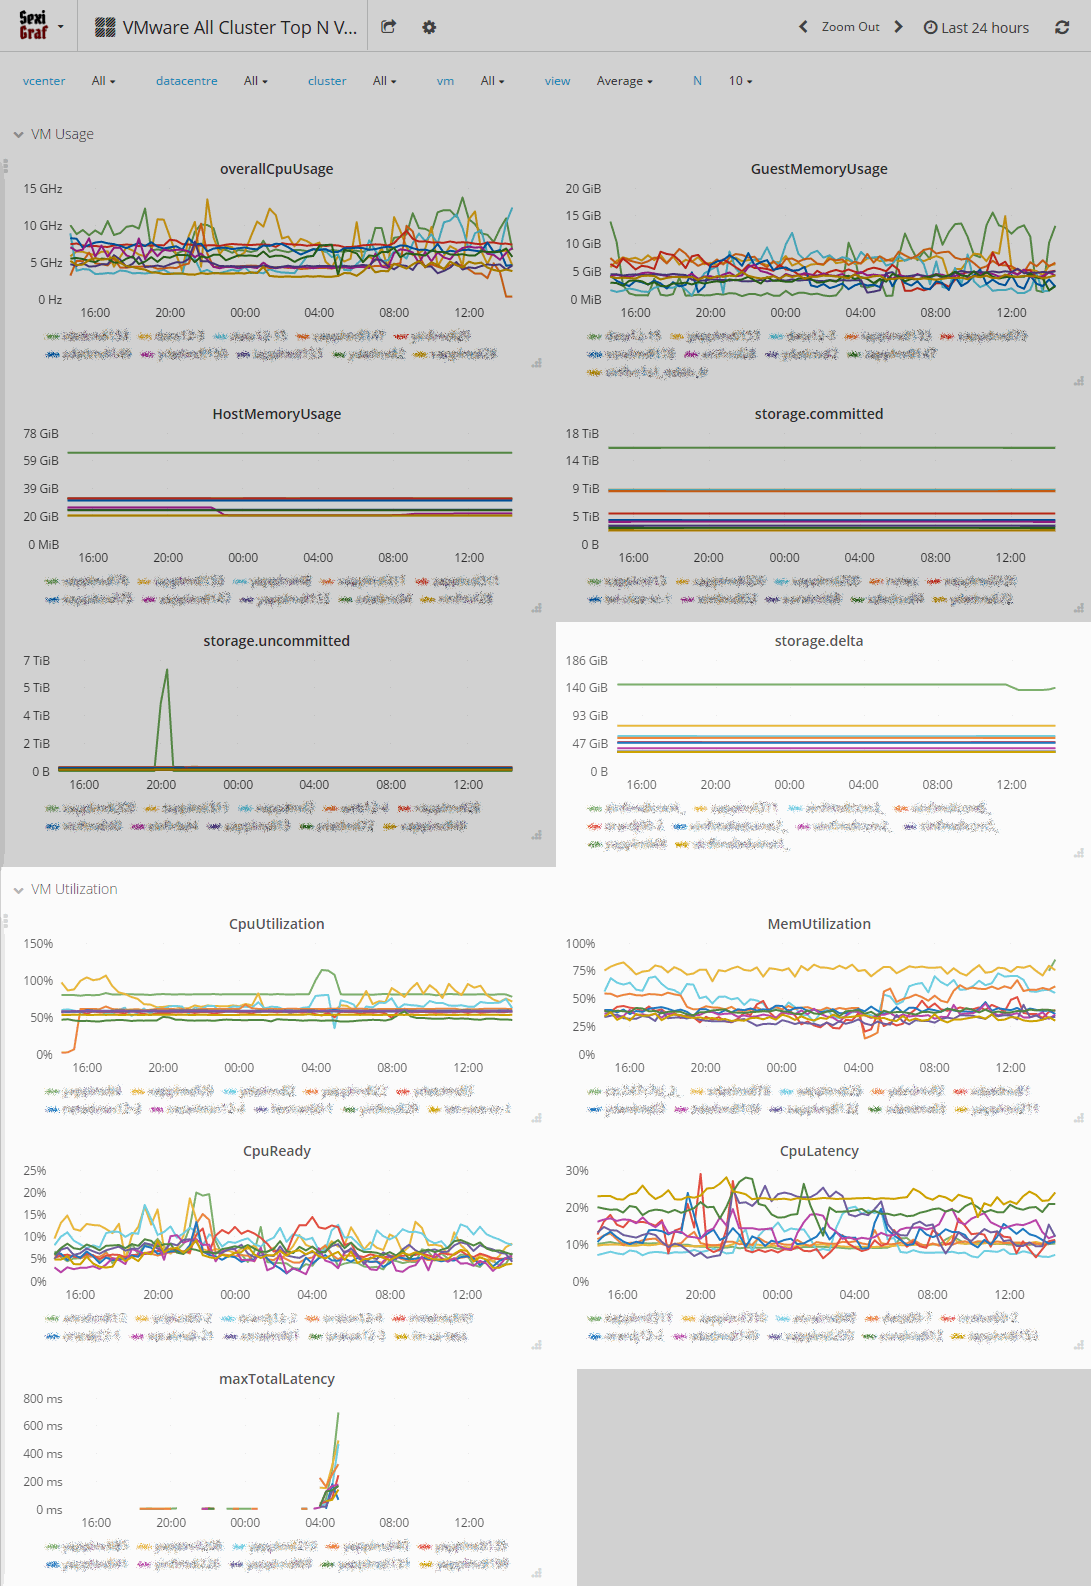
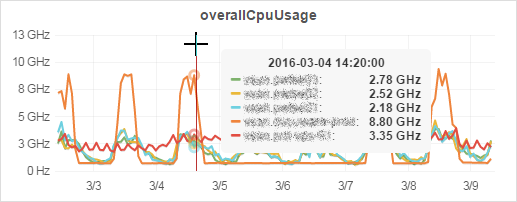
In the PoliGraf 0.99d release, we revisited this dashboard to add snapshot usage (storage.delta), CPU & MEM usage in %, the world famous CPU Ready metric (aka %RDY), CPU Latency (aka %lat_c) and maxTotalLatency. Now you can check everything about all or some specific VMs in a single pane of glass:
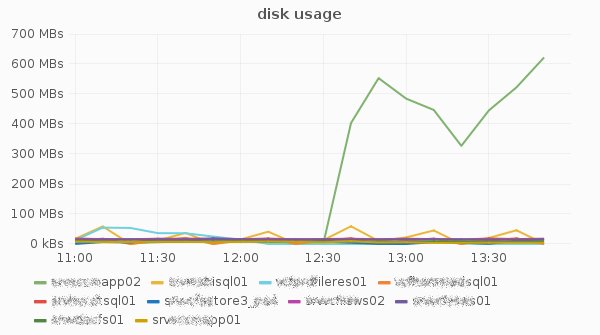
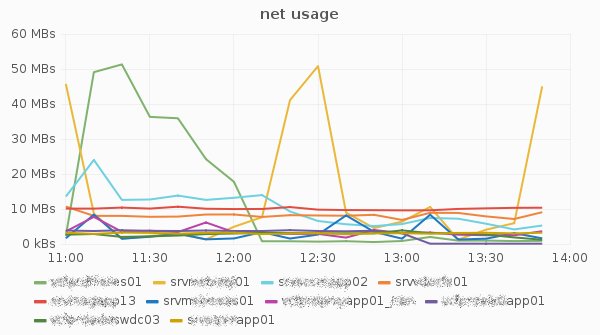
In 0.99e version, we’ve added vm network and disk usage:
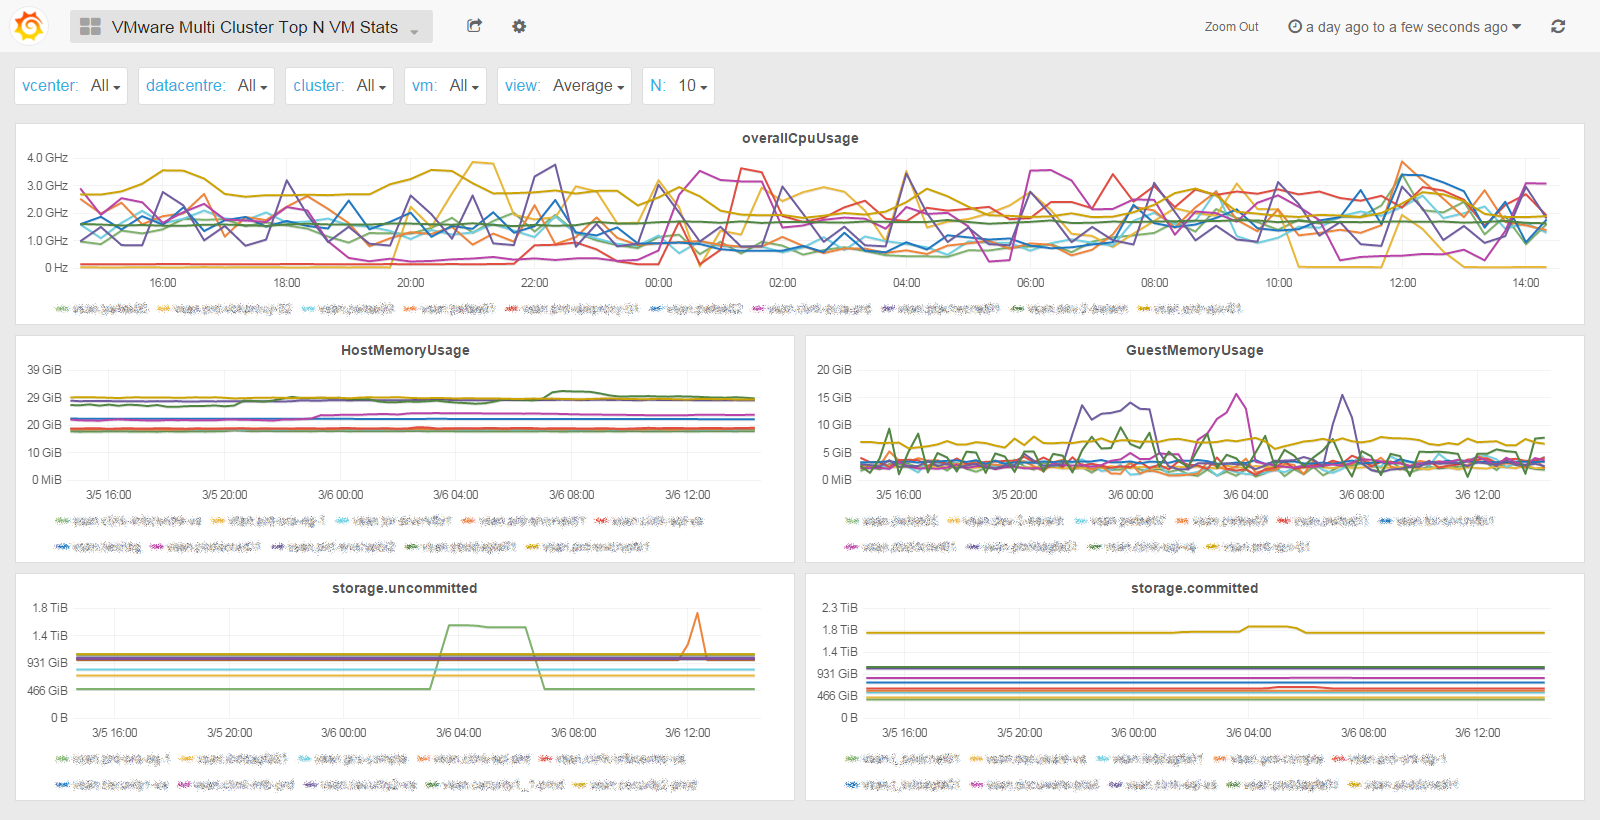
You may want a top 5 VM per cluster instead? We did that too 😉
Check out the Multi Cluster Top N VM QuickStats dashboard and simply slide over to reveal the usual suspects:

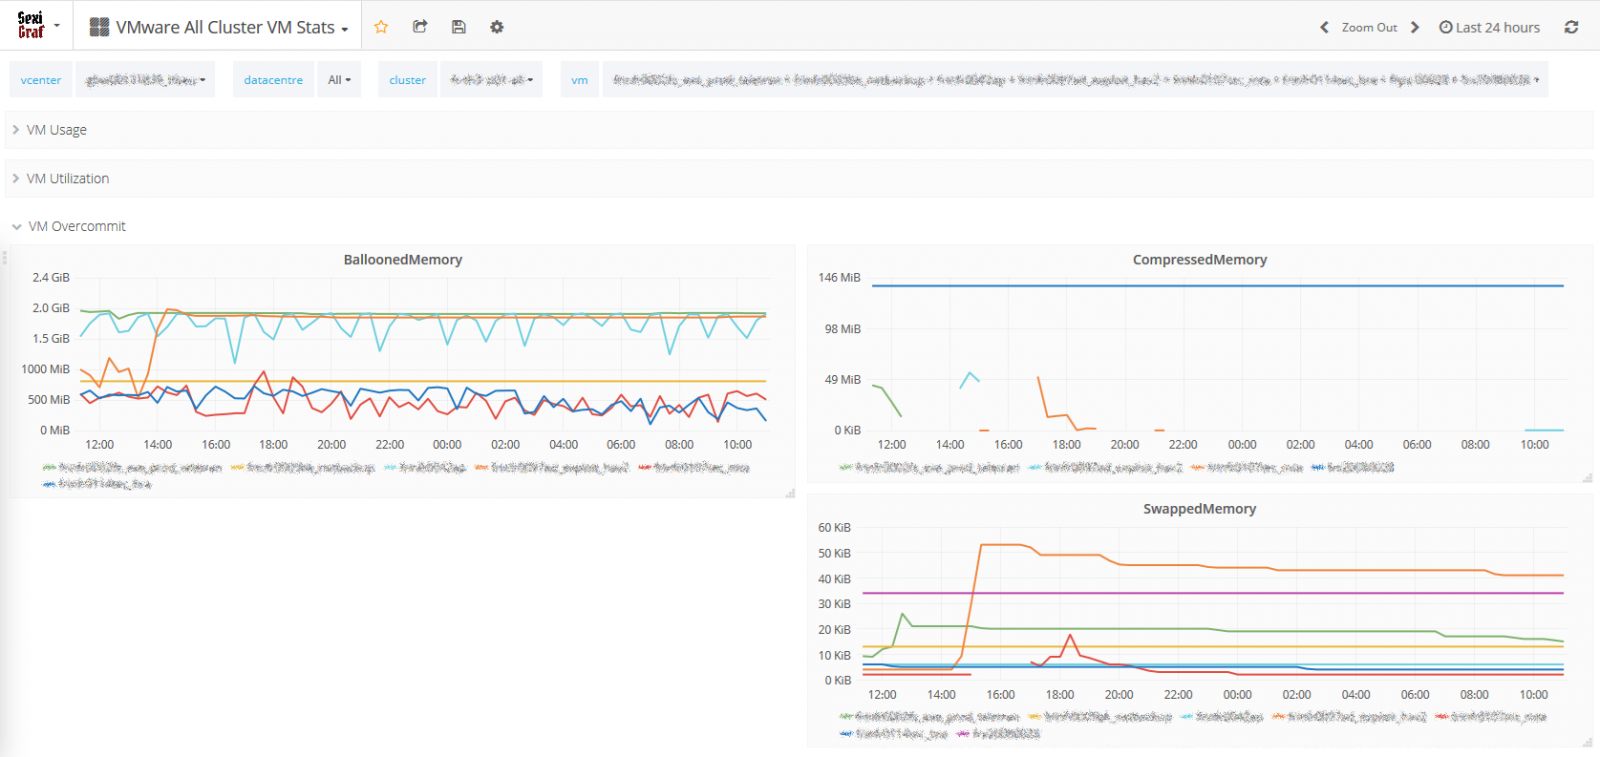
In PoliGraf 0.99f, we’ve added a variant of that dashboard with overcommit metrics but without the Top N feature for those with big inventory just wanting to compare a bunch of VMs: VMware All Cluster VM Stats
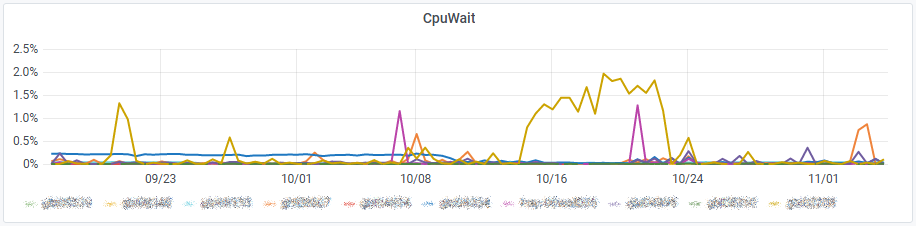
In version 0.99g we’ve added CPU Wait metric from which we deduced CPU idle metric in order to only keep the I/O wait : “The wait total includes time spent the CPU Idle, CPU Swap Wait, and CPU I/O Wait states.”