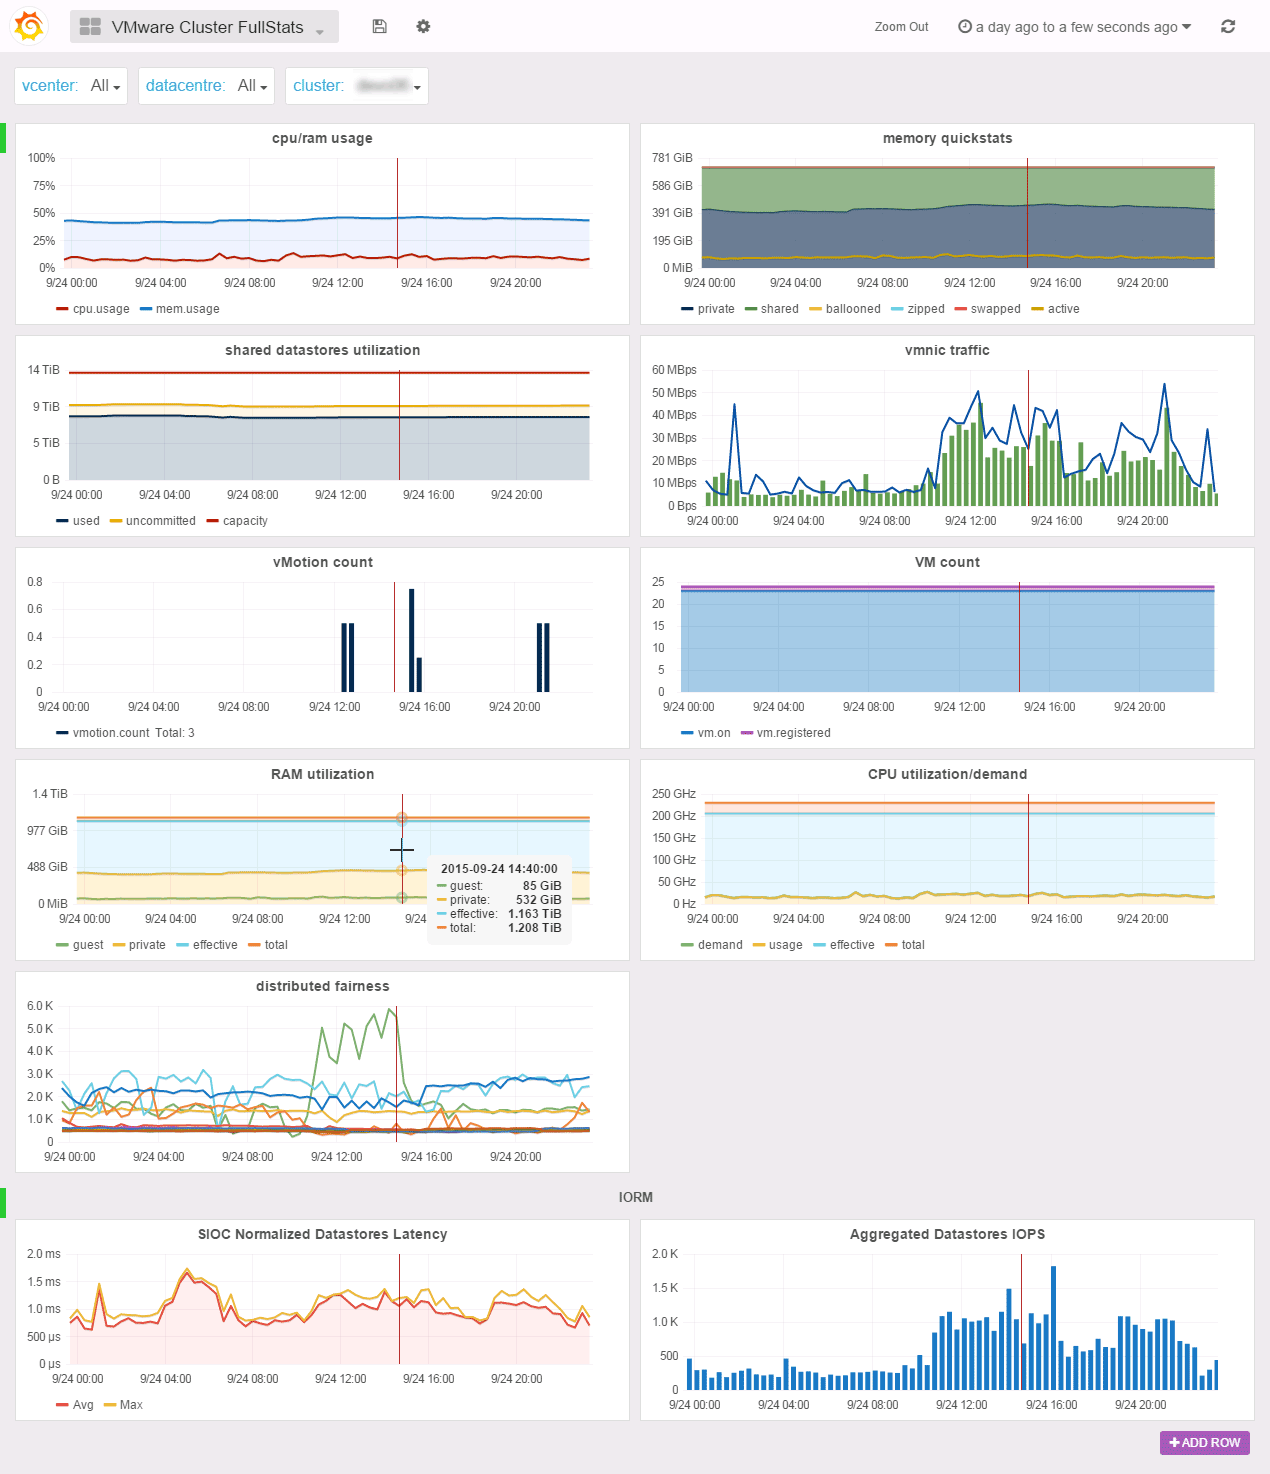
Cluster Fullstats
The Cluster FullStats dashboard offers you a single pane of glass for your cluster performance and usage metrics. You will find simple informations like CPU/RAM usage or vmnic traffic but also complex graph like memory quickstats (inspired by the vCenter Cluster utilization tab) or the distributed fairness graph with the fairness quickstats of distributed CPU/RAM resources allocation on the cluster hosts.
In the IORM row, you’ll find the average latency and the IOPS sum of the cluster shared datastores. The metrics used here were initialy introduced by Storage I/O Control but since vSphere 5.1 you can chose to only collect the stats without enabling SIOC. We encourage you to do enable the stats collection since those counters are really mission critical. Besides, the latency metric resolution is 1 microsecond where the legacy latency metrics resolution is 1 milisecond and normalized meaning cluster wide latency.
If the stats collection is not enabled, we failback to the legacy read/write metrics from a random host in the cluster. Unfortunately, in failback mode you won’t have the aggregated IOPS metric since collecting metrics from all hosts would be very time consuming and we want to keep PoliGraf very fast!
All the metrics you will find here are aggregated to give you a full cluster level experience. For example, the shared datastores utilization graph aggregates all the multipleHostAccess datastores in the cluster so you won’t see local storage here as we hope it does not participate in your vm storage.
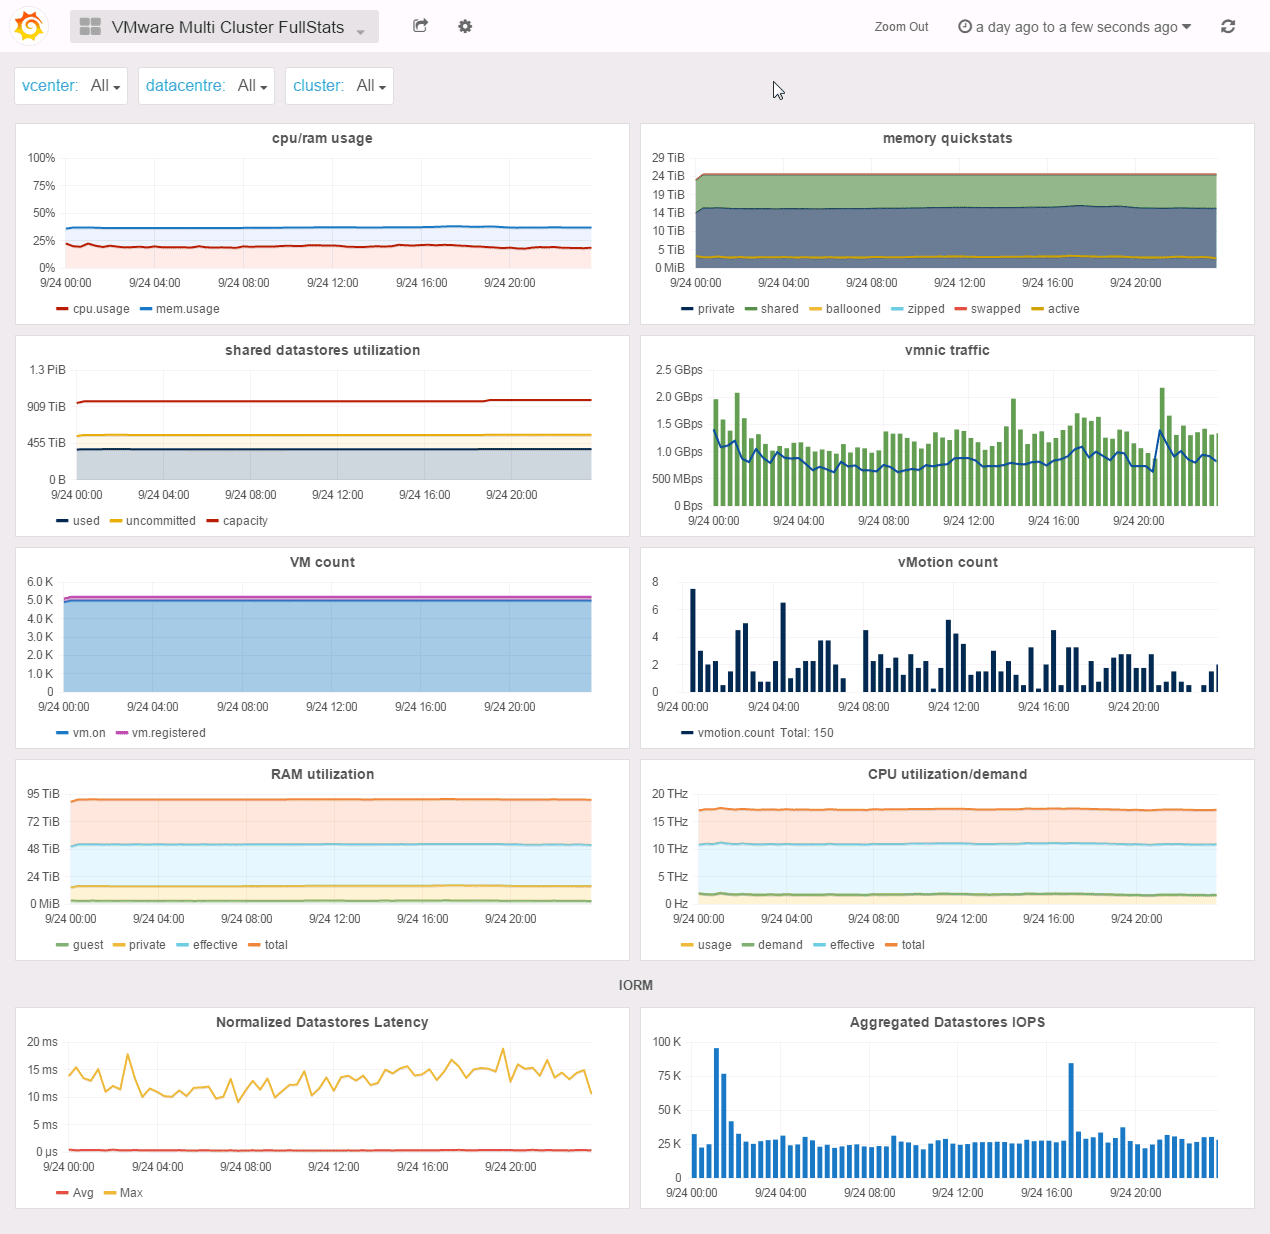
If you need to aggregate clusters, you want to use the All Cluster FullStats dashboard and select the clusters you want to participate in the graphs.
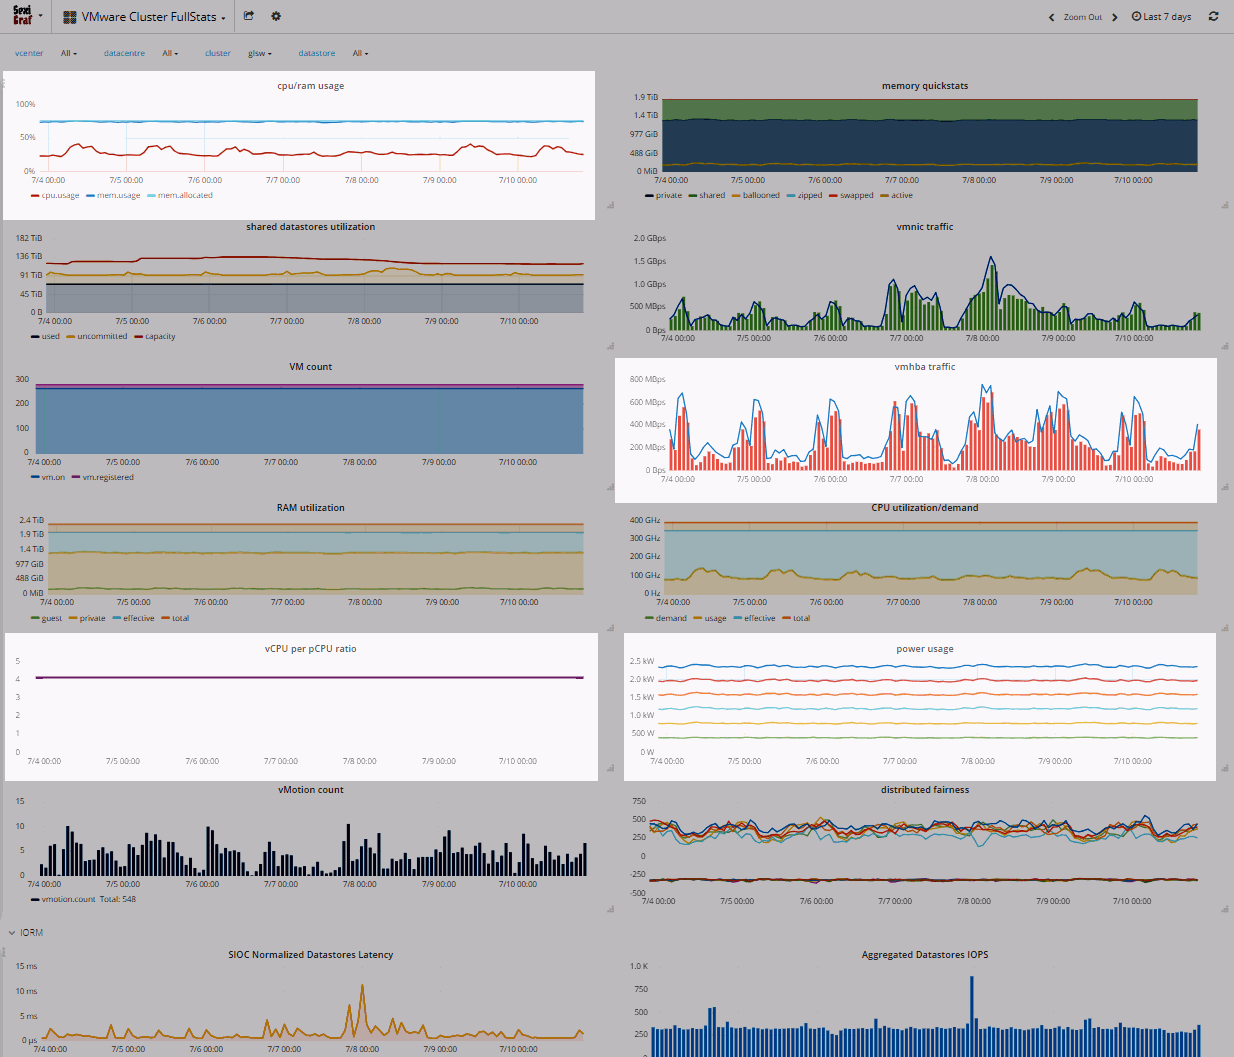
In PoliGraf 0.99d, we’ve added a mem.allocated “computed” metric (aka provisioned memory), the vCPU/pCPU ratio and the Power usage counter (for the hardware vendor that supports it). In version 0.99e, we’ve also added vmhba traffic:
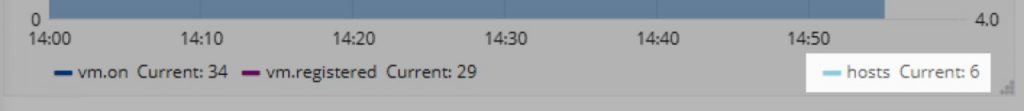
We also added hosts count in the VM count graph :