Top N vmdk

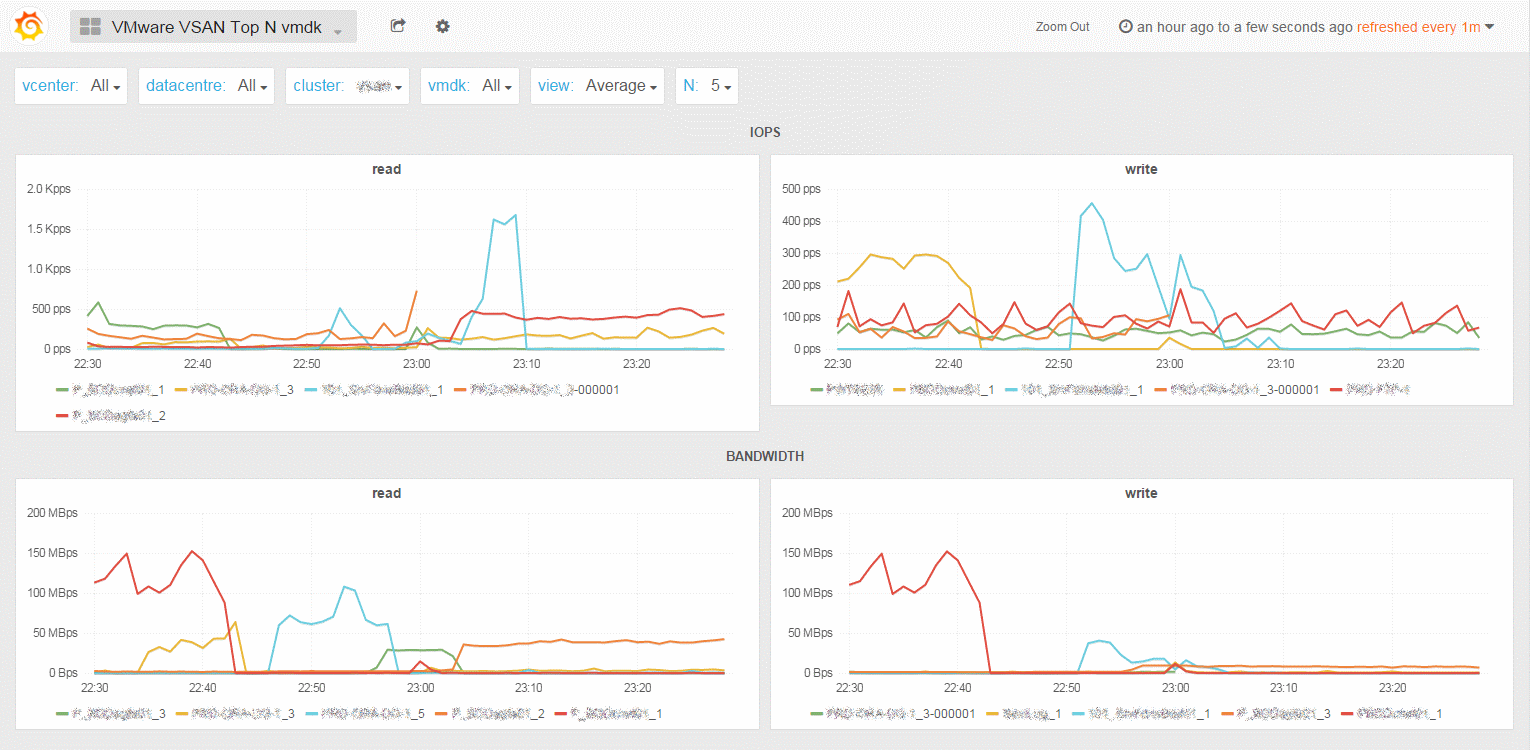
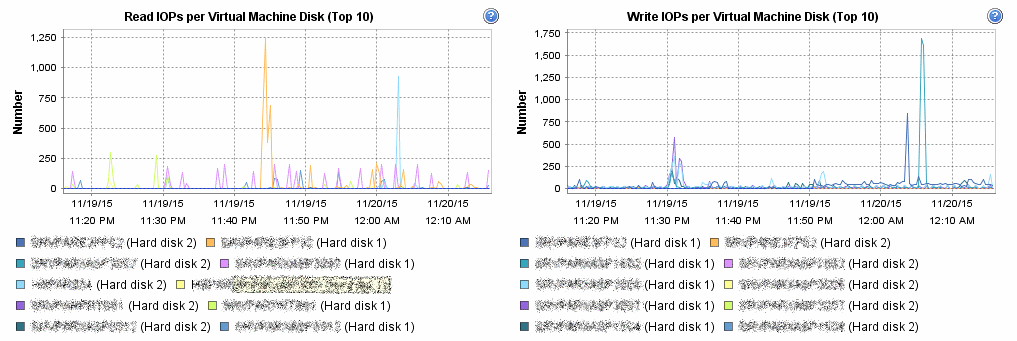
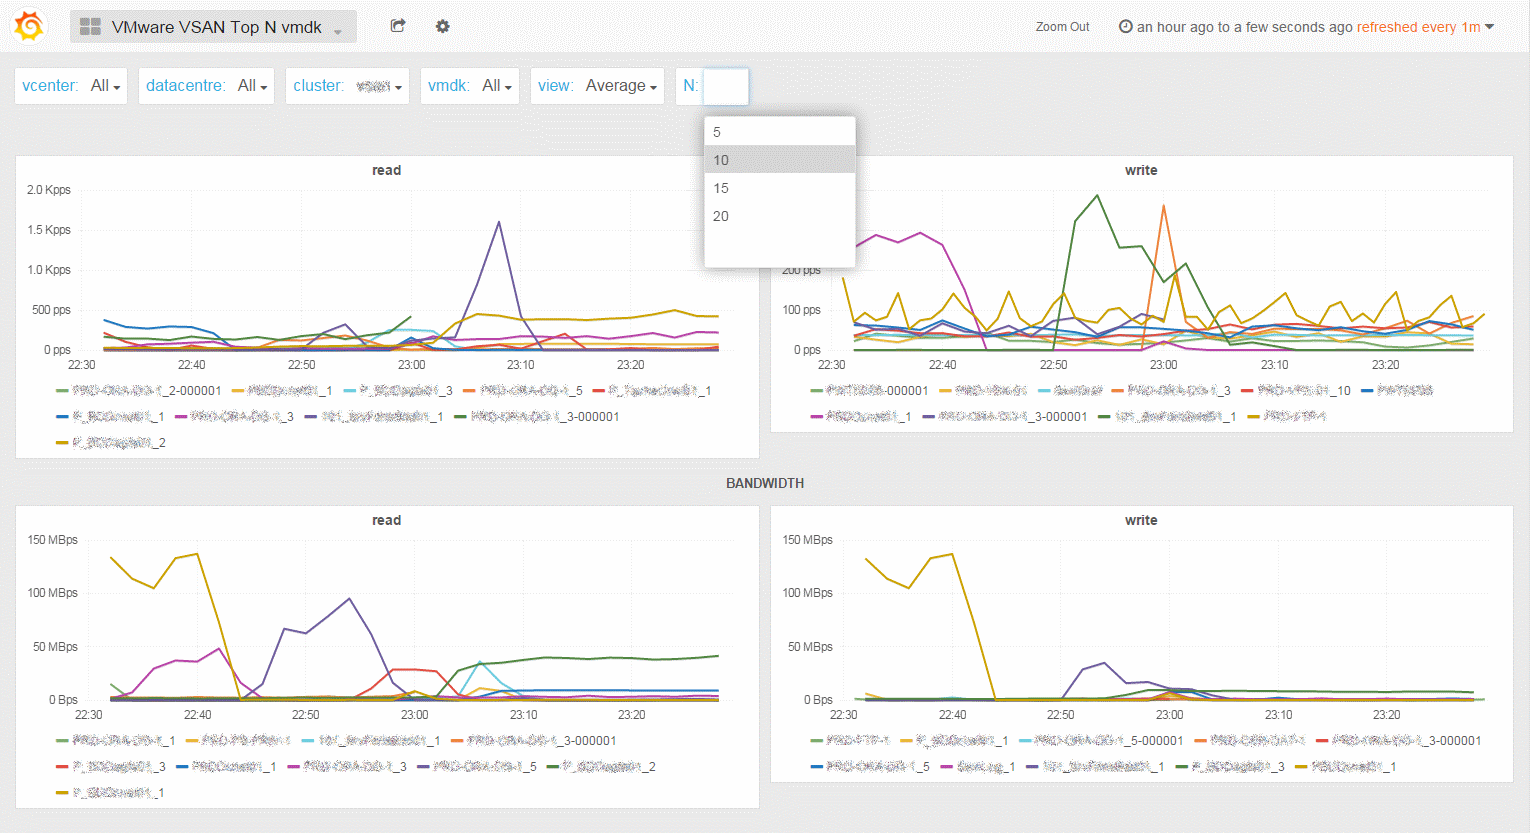
The vSAN Top N vmdk dashboard (added in PoliGraf 0.99a) let you immediately identify the most active VMs on your vsanDatastore “like” the infamously slow Virtual Machine Disk (Top 10) which is not available for vSAN datastores :

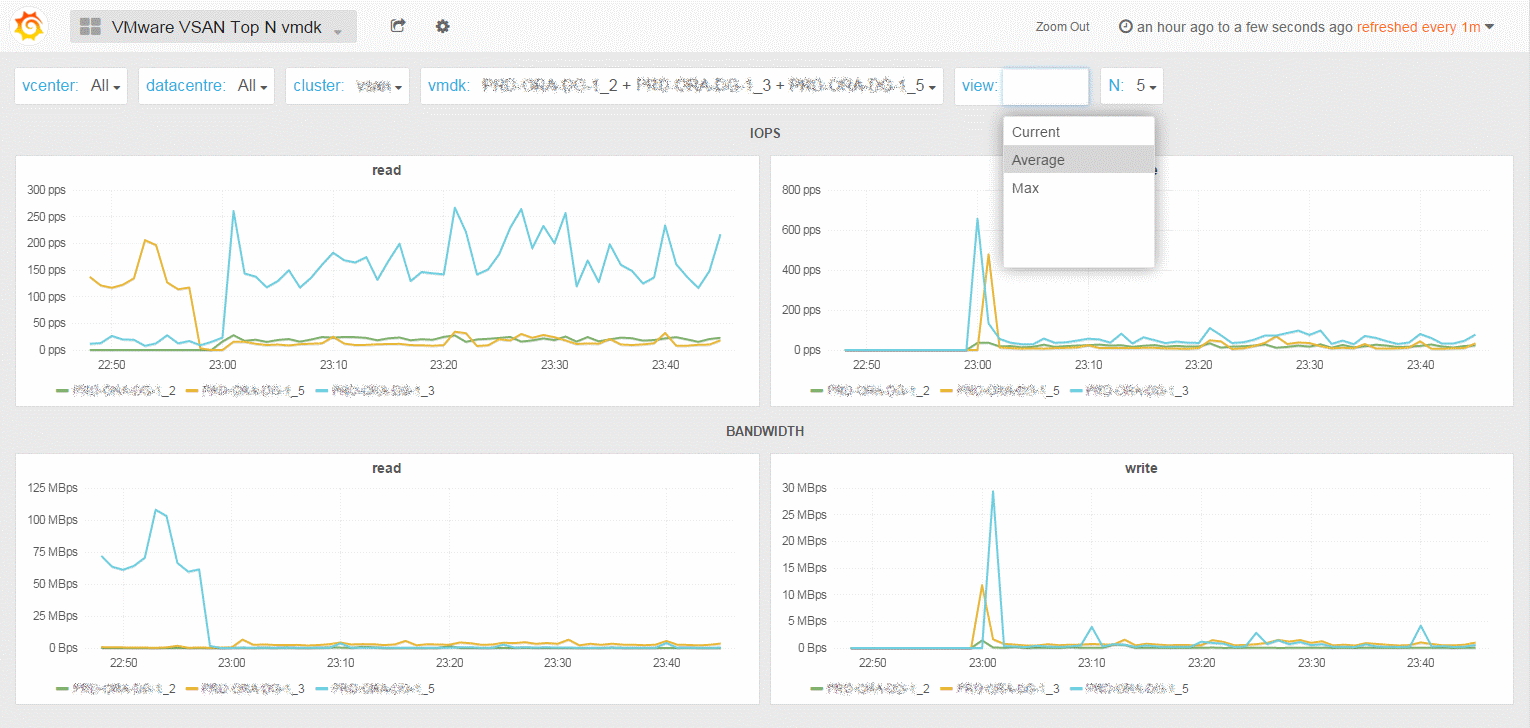
You’ll be able to observe flat vmdk as well as snapshots redo logs activity, select only few vm disks to inspect and also chose between Current, Average or Max consolidation over the selected time range:

