Cluster Multi ESX LiteStats
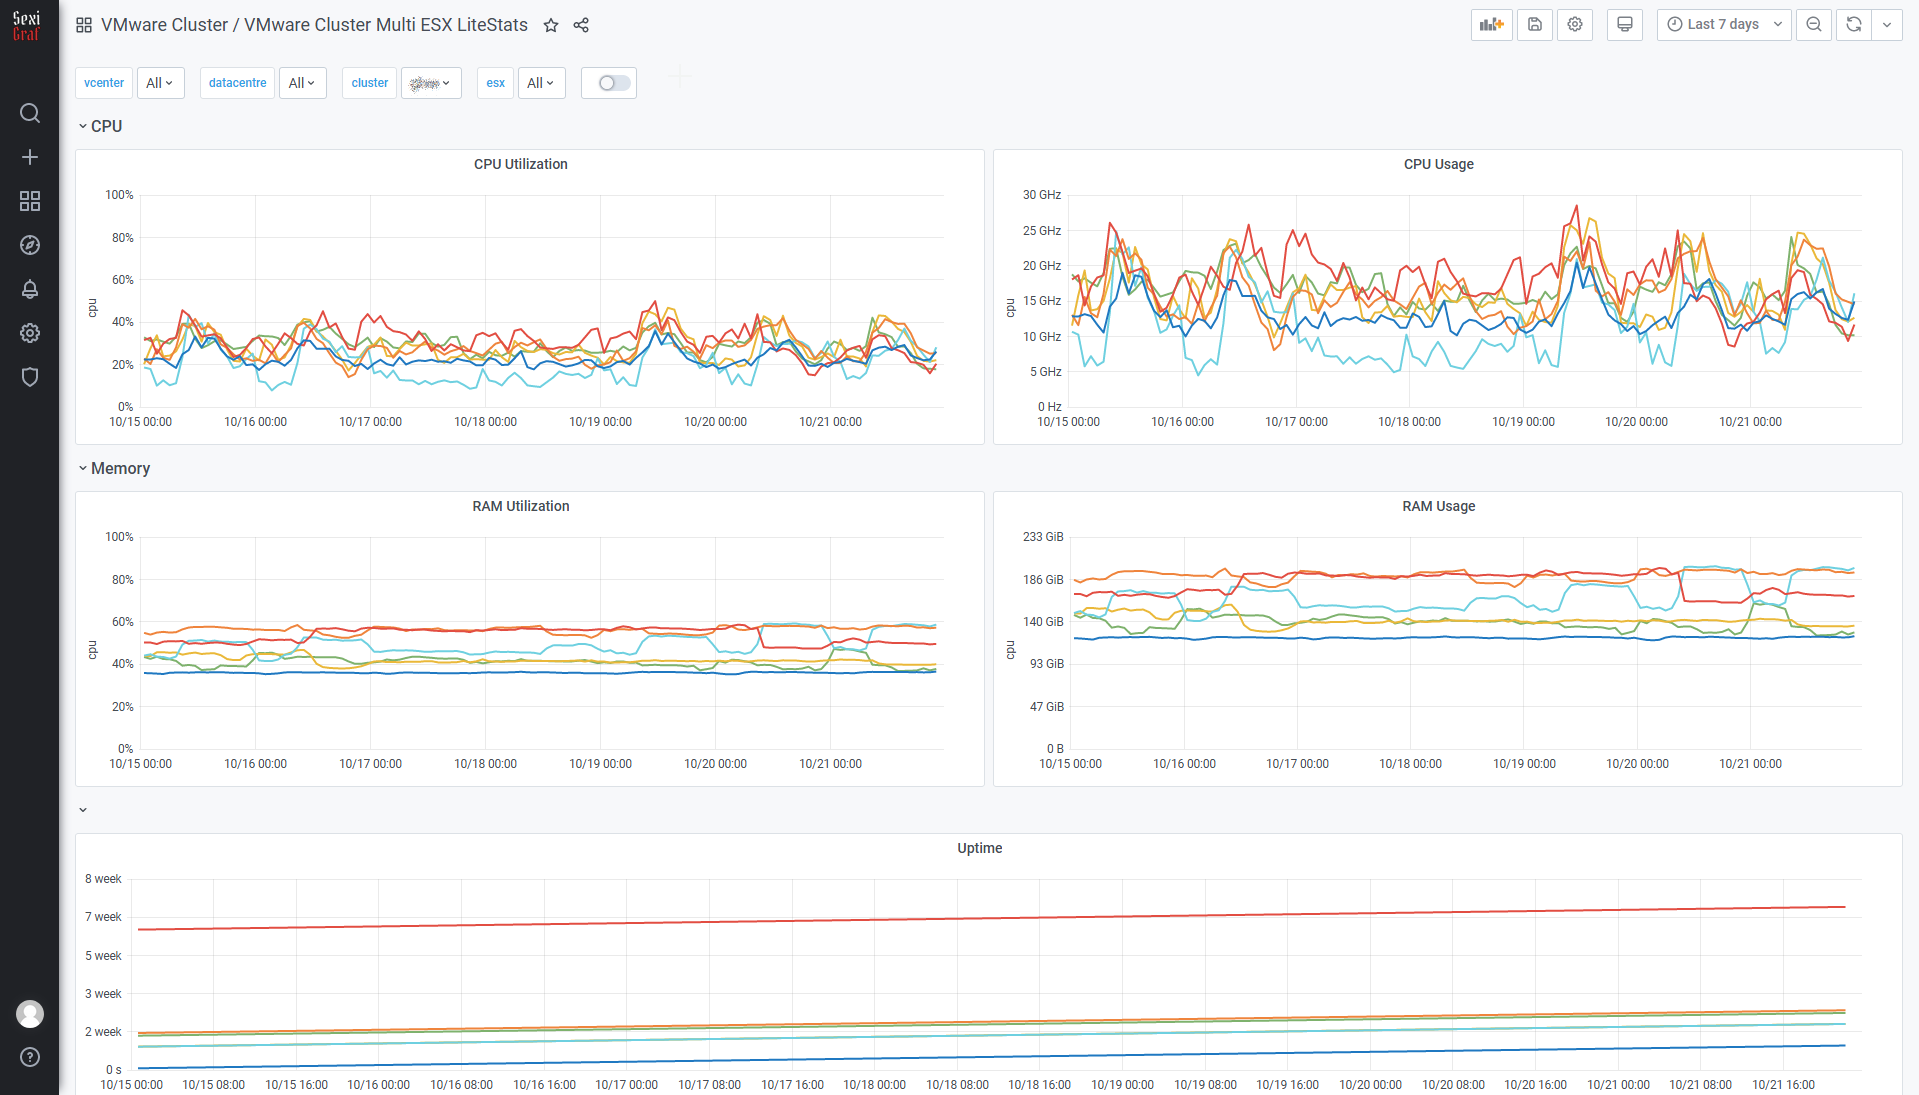
This dashboard has been totally redesigned in version 0.99g so now you can see the usage in percentage or mhz/mb and the uptime on the same graph.

This dashboard has been totally redesigned in version 0.99g so now you can see the usage in percentage or mhz/mb and the uptime on the same graph.
