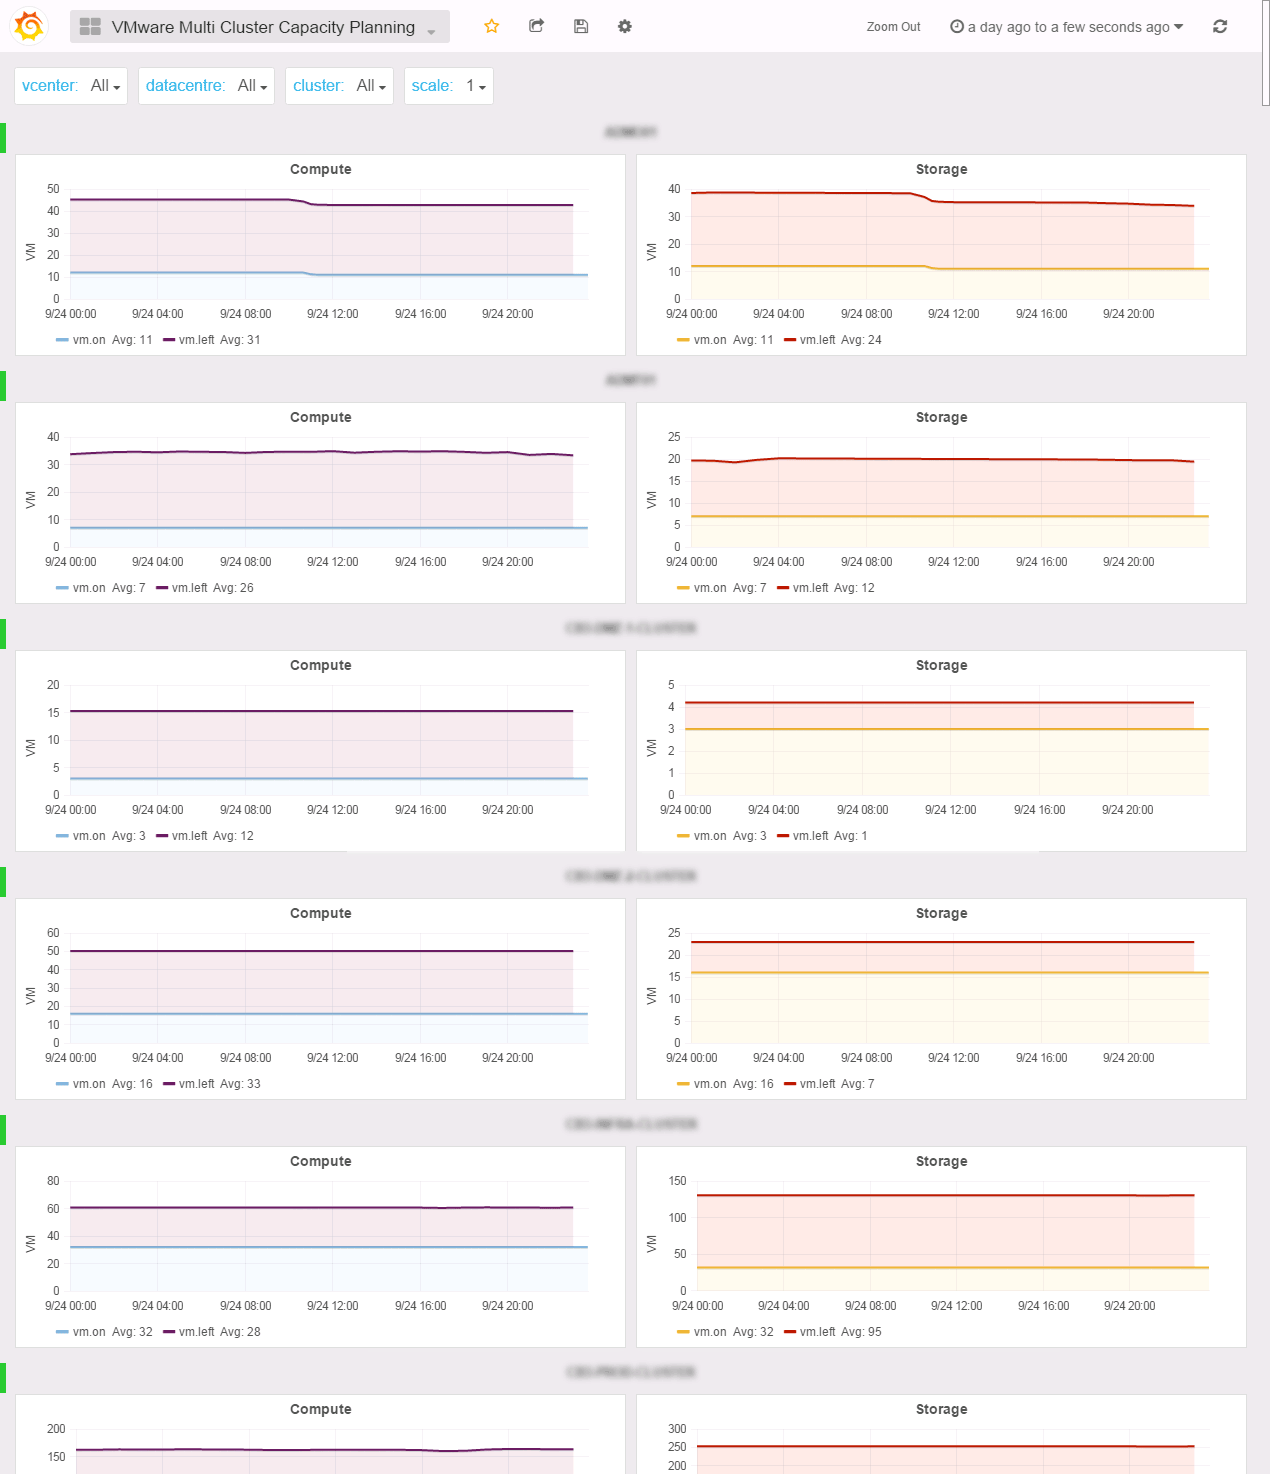
Multi Cluster Capacity Planning
“How many more VMs can we deploy on those clusters?” Your boss probably asked you this one a dozen time. This time is over. This great dashboard shows you how many vm runs and how many you got left based on compute and storage consumption for each cluster.
Want to compare only 3 of them? Just select them in the list. You got different SLA based on overcommit ratios or replication on your DR site? Use the scale variable to change the filling ratio of the compute.
In PoliGraf 0.99f, thanks to Joe’s idea, we’ve added the vm compute and storage averages so you know what the vm left is based on:


